Author: jasonweiblog

Jason Wei – Group 4 Project Personal Reflection – Evaluation Day

During the group four project, I have personally made many substantial contributions to our group, especially within the reach of my subject area -physics. We had a long discussion before we confirmed the effect of electromagnetic radiation on plants as our topic of research, and the opportunity to investigate electromagnetic radiation in real life became my initial motivation in the project. I was eager to find how wi-fi routers could produce electromagnetic radiations with different power flux densities, as well as whether the radiation released by them could actually harm plants and the human body. This motivation helped me to get as much knowledge about our topic as I could, and was crucial for our group to come up with the final explanation of the research.微信图片_20180529002534

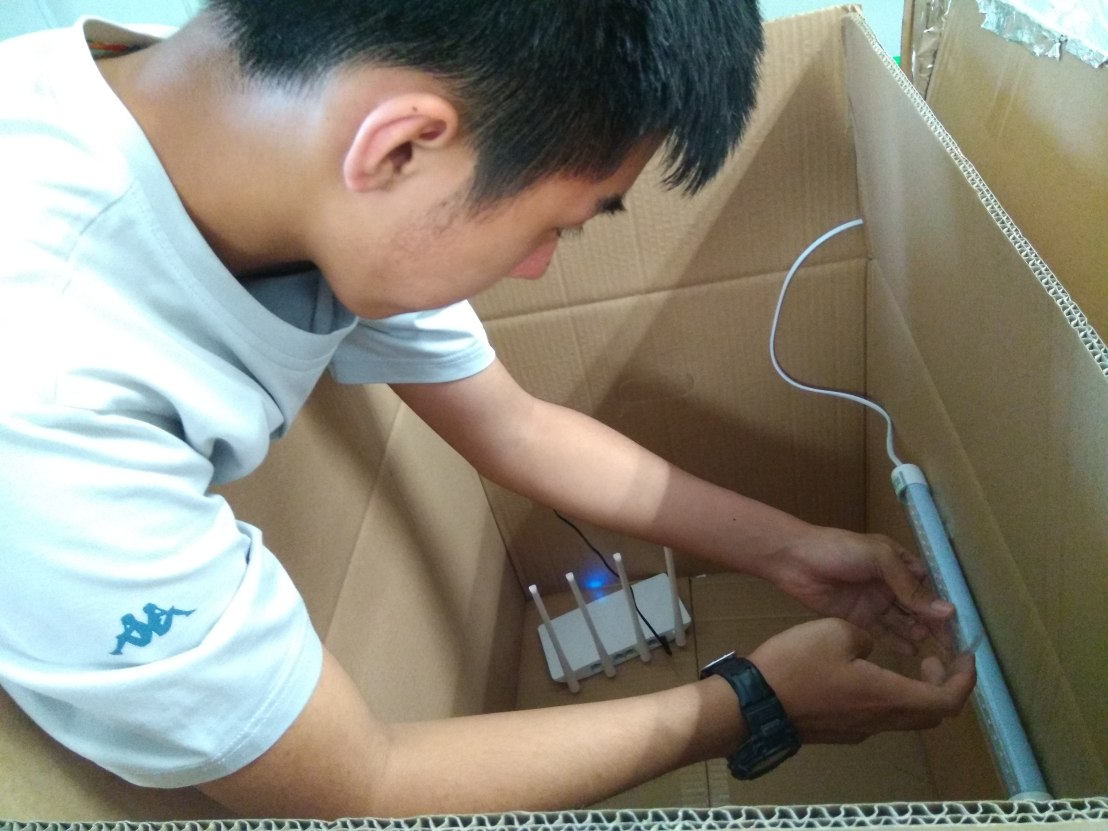
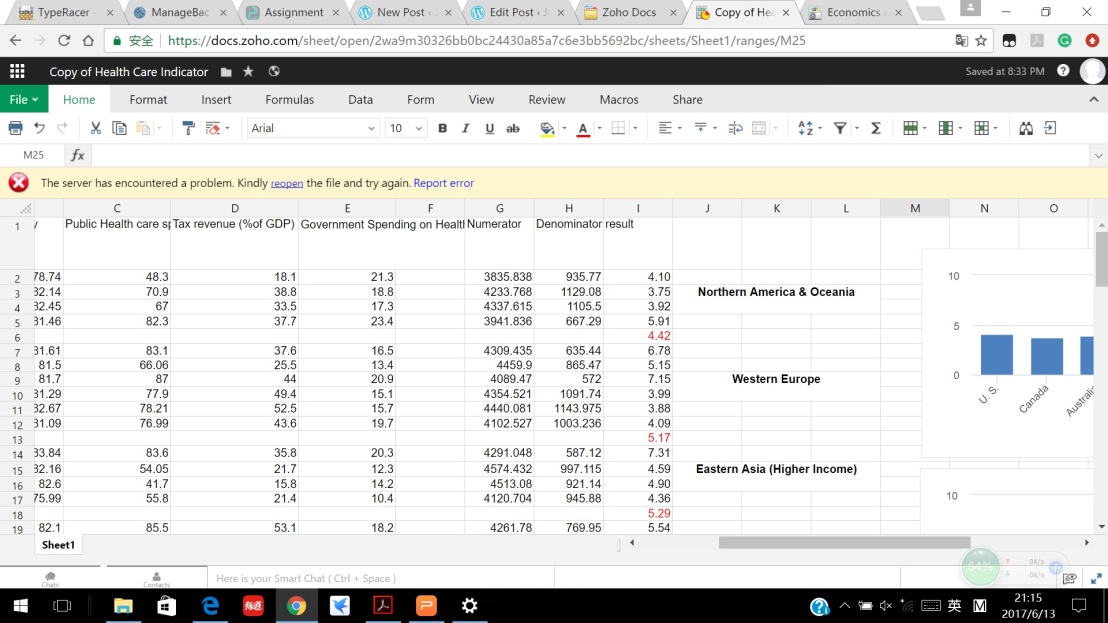
As the experiment proceeded, curiosity was no longer the only source of personal motivation. Through the design and the operation of our experiment, I learned the significance of work distribution and personal responsibility among a team – we could succeed only if everyone performed their assigned tasks properly and efficiently. In order not to drag the progress of our group, I did my best to keep a high energy level and not to be distracted by activities irrelevant to our project. Because the result of our experiment was unexpected by us, I had to spend relatively long time on the online research for data analysis. It was a long and sometimes frustrating process, and it somehow interfered with our plan of starting the video record early. Nevertheless, I constantly tried to calm myself dawn with external forces such as playing music or doing little entertainment activities with my teammates. At the end of the process, it was proven that this sort of activity brought relief to our group and was significant for me personally and for the group to continue working at a high efficiency.微信图片_20180529002457

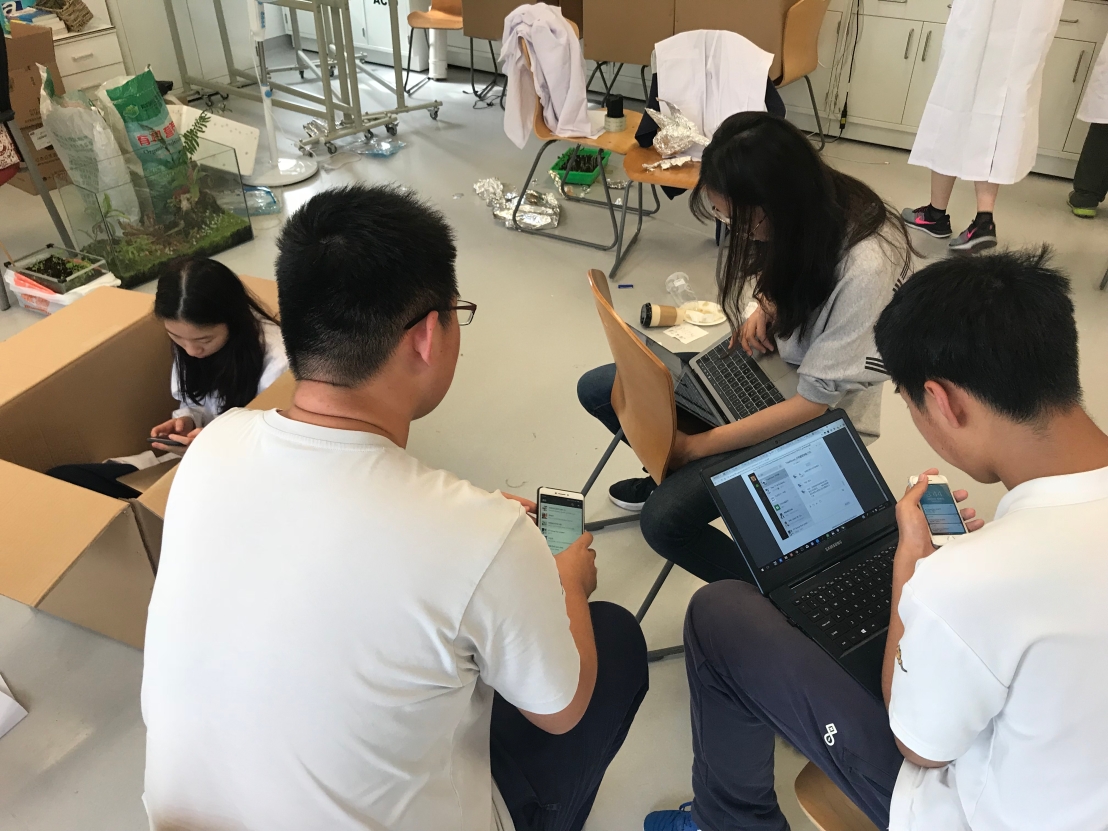
Besides personal perseverance, collaboration is also an essential, and comparatively the core part of the project. As previously mentioned, work distribution was surely important. But the part that we learned the most from is probably communication within the team. At first, we had problems understanding how to control the electromagnetic radiation until I clarified how electromagnetic radiation propagates, how it could be shielded by aluminum foil. Also, my teammates in charge of biology and chemistry explained different stages of soybean growth and confirmed the necessary controlled variables in the germination process with us, which were crucial to the success of the experimental work. One thing we did not accomplish well as a team was to ensure the uniform speed, volume, and video quality of recordings, but it was a minor mistake compared to prior successes achieved by dividing the workload and effective communication.微信图片_20180529002618

Finally, reflecting was an indispensable stage in every further step we took towards the final goal. In the planning day, I evaluated our collaboration in coming up with a research question, which we improved on in the action days. Besides, I reminded myself to start our experiment ahead of schedule due to long time span. In the two action days, my personal reflections actually served as checklists to make sure that I had considered alternative factors that could rebut my judgment in each step I took when writing the data analysis and conclusion. From a broader view, reflections set up daily goals for me and provided me with first-hand information about the process of my engagement in the project.

Jason Wei – Group 4 Project Personal Reflection Action Day 2

Today I have reached most of my goals set yesterday, including finishing the draft for the video and the online research. I also facilitated the production of our final video by showing up as the one who introduces the data analysis and the result of our experiment. Nevertheless, I did not reach all the goals – I still have to record a small part of the final evaluation and send it to the teammate who is in charge of the video production.

微信图片_20180526000406.png

Yesterday’s reflection essentially provided a checklist for me so that I would not forget anything within my responsibility or waste time wondering what to do next. Indeed the reflection worked, but it was not as effective when I met some problems during the drafting stage. I did not plan to discuss my script of the video carefully with my teammates, and after I finished recording it, one teammate pointed out that I missed the explanation of one concept. Although that was a significant mistake, I was not willing to redo the recording process and had some unpleasant interactions with the teammate.

微信图片_20180526011801.png

At first, I just complained and asked why could not he mention it earlier. After a while, though, I realized that this change was necessary for the whole video to make sense to its audience. Considering that only a few hours were left for all the work and I still had to move on to other tasks, I withdrew my bad attitude and recorded the revised draft. Similar cases happened when another teammate was trying to persuade me to reconsider the structure of my draft, which was hard to make changes to already. I initially felt distracted and frustrated, but then reflected on my mode of thinking and accepted the suggestion peacefully.  At the end of the day, although the video and the poster were not finished, we had demonstrated generally good collaboration by getting most of them done.

微信图片_20180526011547.jpg

Currently, there is only one recording left, and I will also need to provide some of the contents that will be included in our poster.

Presentation Reflection

Link to the presentation:  https://docs.zoho.com/show/publish/30xmz17239681d39f42f698d859ac81ea054f

新建位图图像 (7).jpg

The CS & Economics presentation was done cooperatively by David and me, and the theme of our economic measurement was about the effectiveness of medical care in the world. The presentation was separated into several parts, in which we introduced the background and the motivation of our topic, the variables and the formula of the indicator, and finally, some examples of this indicator being applied to different countries in the world (shown in a spreadsheet).

新士大夫建位图图像 (7).jpg

The formula of our indicator may take a while to fully understand due to its complexity. However, we did not do very well on effectively explaining this formula to the audience. The slides of our presentation did not include any pictures, graphs, or diagrams assisting the oral presentation. The time limit also restricted us from clearly explaining all the elements involved in the formula.

Our group cited all sources properly, and the font and the color did not hinder the audience from seeing all the contents on the slides, so I consider that those two requirements have basically been met by our group.

This slideshow requires JavaScript.

The flowchart and the pseudocode we made reflect the process how we came up with the formula of the indicator. We had several conditions and two loops in both the flowchart and the pseudocode, in which we processed the information inputted (for example, the different variables that we considered to be parts of the indicator) and got some results as output.

The spreadsheet gathers the data of all indicators from some countries in its first several columns, and then a function calculates the result according to the raw data and the given equation. The final figures are recorded in the last column. Charts that show these final data graphically help to make comparisons between countries and regions.新建位图图

The link to the spreadsheet is:  https://docs.zoho.com/sheet/published.do?rid=2wa9m30326bb0bc24430a85a7c6e3bb5692bc


Class Reflection Week 13

Spreadsheet software basically provides its users with a series of charts where data can be inputted, ordered and analyzed freely. The most prevalent type of spreadsheet software now is Excel produced by Microsoft. A typical spreadsheet software looks exactly like it:新建位图图像 (3).jpg

Clearly, a separate sheet in a spreadsheet is comprised of columns labeled in alphabet and rows labeled with numbers. To locate any single cell in the whole sheet, we only need to click on it with the mouse.

The most common application of spreadsheet software in real life is statistics – gathering and analyzing data collections. A typical example of this is when recording students’ scores and ranks in an exam – every student’s result of the scores for different subjects are inputted into the spreadsheet, and the spreadsheet software will automatically give the sums (or average) of scores from every subject for students as long as there is a formula inputted. Also, the spreadsheet helps to rank the scores of students from high to low to compare the performance of different students. This type of usage of spreadsheets is very common in national programs in Chinese middle schools.

In a spreadsheet, functions can be utilized to make the statistics more efficient and can reduce the workload of recording. A simple example of a function is “average” function, which saves the work of manually creating formulas to calculate the average of a set of data. If the user intends to emphasize certain unit cells with different colors, he can use the condition function (shown by “IF”) to make selections towards specific value range (such as those students who scored higher than 90) and then label it with colors or words like “good”.

新建位图图像 (.jpg

This a screenshot of the spreadsheet created in class. It records a series of imaginary scores of IB students and makes some comparisons and analysis. It includes not only sheer data but also some equations, functions, and a chart based on the set of data. The functions involved are “average” (results are shown in column H), “if” functions (shown in column C, E, G, and I determining which IB grade each student gets), and “concatenate” (formula is shown in the, which arranges complete sentences by using information in preceding unit cells. The chart illustrates the performance of each student graphically.

Generally speaking, a spreadsheet is extremely useful in real life when we do statistics and analysis. Spreadsheet software serves as an auxiliary tool in a wide variety of tasks and jobs.