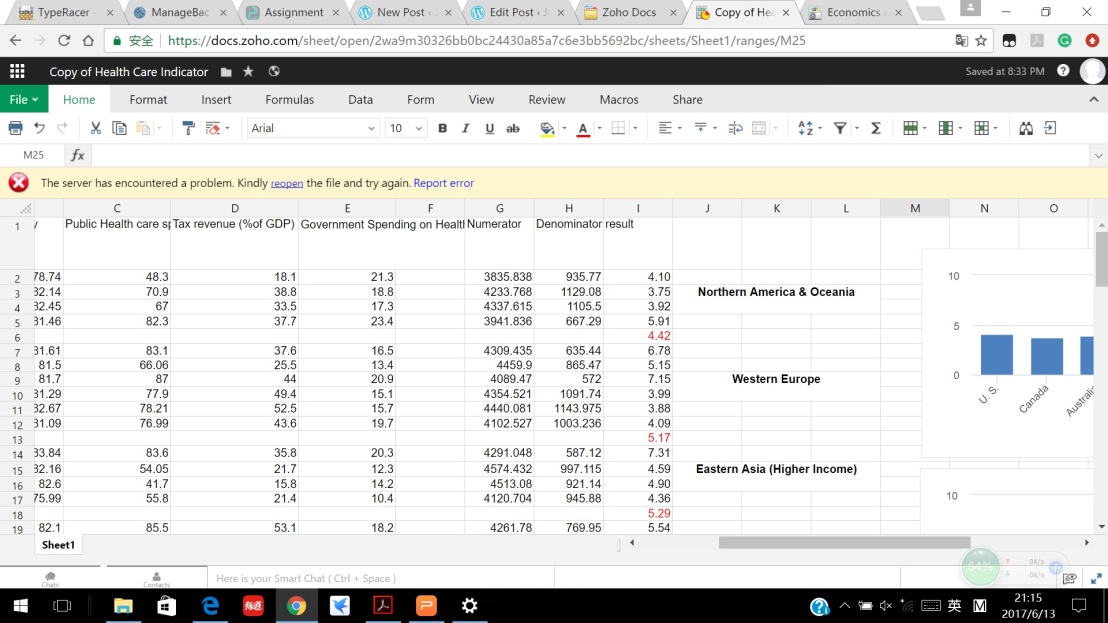
Spreadsheet software basically provides its users with a series of charts where data can be inputted, ordered and analyzed freely. The most prevalent type of spreadsheet software now is Excel produced by Microsoft. A typical spreadsheet software looks exactly like it:
Clearly, a separate sheet in a spreadsheet is comprised of columns labeled in alphabet and rows labeled with numbers. To locate any single cell in the whole sheet, we only need to click on it with the mouse.
The most common application of spreadsheet software in real life is statistics – gathering and analyzing data collections. A typical example of this is when recording students’ scores and ranks in an exam – every student’s result of the scores for different subjects are inputted into the spreadsheet, and the spreadsheet software will automatically give the sums (or average) of scores from every subject for students as long as there is a formula inputted. Also, the spreadsheet helps to rank the scores of students from high to low to compare the performance of different students. This type of usage of spreadsheets is very common in national programs in Chinese middle schools.
In a spreadsheet, functions can be utilized to make the statistics more efficient and can reduce the workload of recording. A simple example of a function is “average” function, which saves the work of manually creating formulas to calculate the average of a set of data. If the user intends to emphasize certain unit cells with different colors, he can use the condition function (shown by “IF”) to make selections towards specific value range (such as those students who scored higher than 90) and then label it with colors or words like “good”.

This a screenshot of the spreadsheet created in class. It records a series of imaginary scores of IB students and makes some comparisons and analysis. It includes not only sheer data but also some equations, functions, and a chart based on the set of data. The functions involved are “average” (results are shown in column H), “if” functions (shown in column C, E, G, and I determining which IB grade each student gets), and “concatenate” (formula is shown in the, which arranges complete sentences by using information in preceding unit cells. The chart illustrates the performance of each student graphically.
Generally speaking, a spreadsheet is extremely useful in real life when we do statistics and analysis. Spreadsheet software serves as an auxiliary tool in a wide variety of tasks and jobs.